Key Metrics to Track in Your Water Delivery Management Software
“You can’t manage what you can’t measure.” – Peter Drucker (an Austrian American management consultant)
Today the deliveries are not just limited to getting from one point to another but also include optimized routes, timely deliveries, and personalized customer service. But how do you know your business is growing and thriving?
This is where water delivery management software with AI-powered analytics comes in.
This blog explores all the essential key performance indicators you can track and monitor with water delivery software, empowering you to make informed decisions and improve business operations.
What is a delivery management software?
Water delivery management software is a SaaS-based cloud system that helps you plan, manage, and track orders, deliveries, inventory, and payments. It automates and streamlines your delivery business operations from ordering processing and inventory optimization to delivery planning, and payment collection and reconciliation.
Features of TrakOp’s delivery management software
TrakOp offers water delivery software to automate and optimize your business operations. It comprises three components: a business dashboard, a customer app, and a driver app. Features of this delivery system:
- Order management
- Scheduled deliveries
- Inventory and asset management
- Finances and accounting
- Driver management
- Delivery planning and route optimization
- Multiple payment options
- Electronic proof of delivery and payment
- Reporting and analytics
- Auto-dispatching
- Promotional features
- Customer relationship management
- Real-time tracking
- Notification and communication
This blog article focuses on the key performance indicators delivery management software provides on its business dashboard. The business dashboard is highly customizable and can be tailored to track and monitor key performance indicators based on your business requirements.
What are key performance indicators?
Key performance indicators (KPIs) are measurable values that determine how well a business is performing. They are quantifiable business metrics to help you track and assess business health and focus efforts toward a common goal.
Here we’ll discuss the key performance indicators based on each business operation of a delivery business.
Types of key performance indicators
KPIs can be categorized into various types based on business departments and the nature of measurement, including financial, sales, customer service, deliveries, order fulfillment, and lagging and leading indicators.
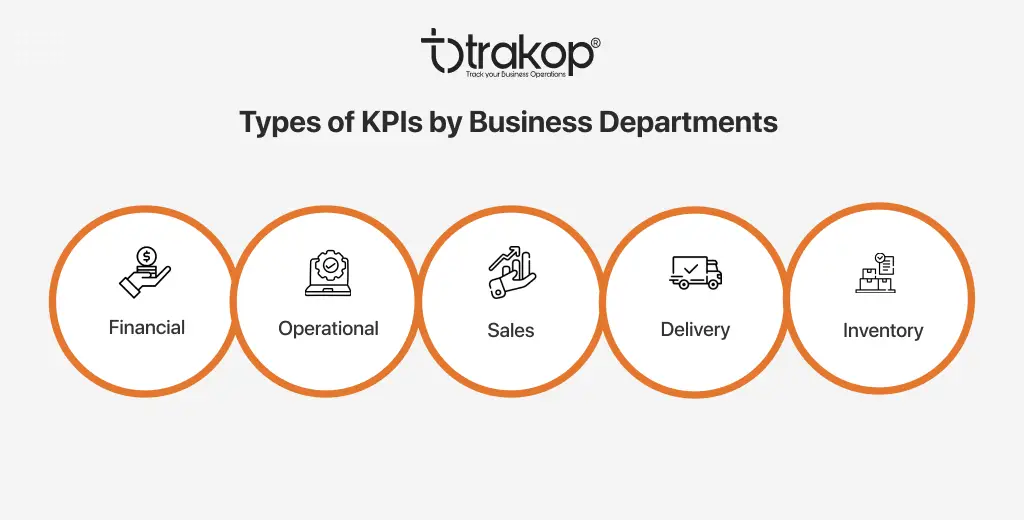
Types of KPIs by business departments
- Financial – These metrics focus on a business’s finances, such as revenue, profit margin, and debts.
- Operational – Measures effectiveness and efficiency of daily tasks, including productivity, cycle time, and capacity utilization.
- Sales – These metrics track sales performance, such as customer acquisition, conversion rate, and acquisition cost.
- Delivery – These metrics measure your delivery performance, including delivery accuracy, on-time delivery rate, delivery time variance, order accuracy, cost per delivery, and more.
- Inventory – Metrics that help you monitor and make decisions about stock. They provide information about inventory turnover, sales, demand, costs, process success, and relationships.
Types of KPIs by nature of measurement
- Lagging KPIs – Measure past performance, providing improvement context, such as revenue, profits, and customer satisfaction rates.
- Leading KPIs – Anticipate future performance and are used to predict results, including sales and customer engagement rates.
- Strategic KPIs – These are related to the strategic business goals and objectives.
- Actionable KPIs – They are designed to drive actions and make informed decisions.
- Customer KPIs – Focus on customer satisfaction, loyalty, and lifetime value.
Key performance indicators to track with water delivery management software
Every business defines its key performance based on strategic objectives. These objectives are translated into measurable metrics while ensuring KPIs are specific, measurable, achievable, relevant, and time-bound. Here we’ll discuss various KPIs based on the operations of a delivery business. KPIs businesses should track with bottled water delivery management software are:
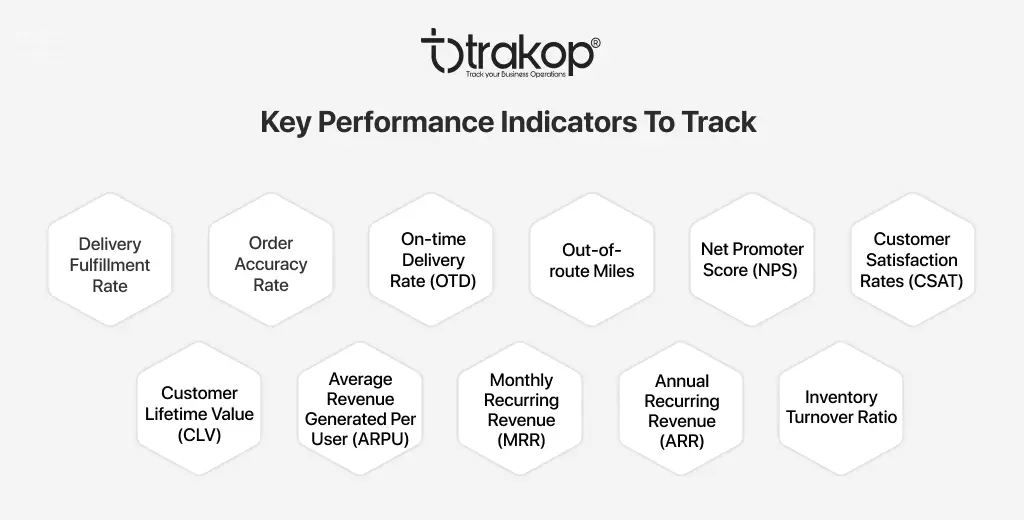
Delivery fulfillment rate
Also known as fill rate, it measures the percentage of customer orders delivered on time and in full. The delivery fulfillment rate monitors how efficiently a business can process, ship, and fulfill orders without disruptions.
Delivery fulfillment rate = (number of orders fulfilled/total orders received) x 100
A higher fulfillment indicates delivery operational efficiencies and enhanced customer satisfaction.
Order accuracy rate
It measures the percentage of orders fulfilled correctly, which includes the right product, quantity, and timely delivery.
Order accuracy rate = (accurate orders delivered/total processed orders) x 100
A higher accuracy rate is essential for customer satisfaction, operational efficiency, and profitability.
On-time delivery rate (OTD)
It is the percentage of orders delivered in the promised timeframe. This metric helps businesses to measure their ability to meet customer expectations while ensuring customer satisfaction and delivering products on time.
On-time delivery rate = (number of orders delivered on time/total number of orders shipped) x 100
A high on-time rate is a key indicator of delivery efficiency and customer satisfaction. 95% or above on-time delivery rate is considered good.
Out-of-route miles
It refers to the extra miles the driver travels beyond the planned route due to inaccurate routing or detours. This can impact fuel efficiency and delivery times. Out-of-mile are the additional distances that are not pre-planned or included optimized routes.
Monitoring out-of-route miles can help you implement strategies to minimize them, improving fuel and operational efficiency, and on-time deliveries.
Net promoter score (NPS)
It is a customer experience metric that measures how likely customers are to recommend a product or service on a scale of 0 to 10. It is a widely used metric to assess customer loyalty and satisfaction
Categories of responses:
- 9 to 10 Promoters – These customers recommend your product and service to drive growth.
- 7 to 8 Passives – Customers who are satisfied but are not excited and vulnerable to competitors.
- 0 to 6 Detractors – They are unhappy customers who can harm your brand image.
Customer satisfaction rates (CSAT)
This indicator shows how well a company fulfills customers’ needs and expectations. A good CSAT score is between 70% and 85%.
CSAT = (number of satisfied customers (who rate 4 or 5 on the scale)/total number of responses) x 100
A higher customer satisfaction rate improves retention rates and loyalty.
Customer lifetime value (CLV)
It is a metric that estimates the total revenue generated from a customer throughout their relationship with the business. To calculate CLV, consider purchase value frequency and customer lifespan.
This metric helps you identify high-value customers, improve your retention rate, optimize marketing expenses, and improve decisions.
Average revenue generated per user (ARPU)
It is a metric that measures the average revenue generated from each user in a given timeframe. It helps businesses understand how much revenue is generated from a single user. This timeframe can be one month, a quarter, or a year.
ARPU = Total Revenue/number of users
Monitor ARPU helps businesses track customer and revenue growth over time, make informed pricing, marketing, and product development decisions, and identify high-value customers.
Monthly recurring revenue (MRR)
It is the predictable revenue a business generates monthly from active subscriptions. MRR is the most predictable form of revenue and doesn’t include one-time fees. It is one of the main KPIs for subscription-based businesses.
MRR = Number of subscribers x ARPU
Monthly recurring revenue helps businesses forecast future revenue and make informed investment decisions, provides business health (efficiency and finances) insights, and attracts business inventors.
Annual recurring revenue (ARR)
ARR is a key metric for subscription businesses, which includes the total revenue expected from recurring subscriptions over a year and doesn’t consider one-time sales.
ARR = Total number of subscribers x Monthly ARPU x 12
ARR enables businesses to monitor their financial health, anticipate future profits, and plan growth strategies.
Inventory turnover ratio
It refers to the rate at which inventory stock is sold, used, and replaced in a given timeframe. Analyzing the inventory turnover ratio against the industry benchmark and historical trends provides insights into operational efficiency.
Inventory turnover ratio = COGS/average value of inventory
COGS is the cost of goods sold. Higher inventory turnover refers to strong sales and vice versa.
How does TrakOp help you track your KPIs?
TrakOp’s bottled water delivery management software provides a comprehensive business dashboard to measure, track, and monitor your predefined key performance indicators. The system is AI- and ML-powered, empowering businesses to scale while improving their operational efficiency and productivity and reducing costs. To learn more about TrakOp, book a demo.
Hope You Enjoyed the Read!


He loves to explore. His passion for helping delivery industries in all aspects flows through in the vision he has. In addition to providing smart solution to make delivery process flawless, Ravi also likes to write sometimes to make it easier for people from business industry looking for digital solutions.
Related Blogs
How Does TrakOp Help You Manage B2B Bottled Water Business Operations?
Learn how TrakOp simplifies B2B bottled water business operations with features like recurring order scheduling, bottle tracking, & inventory monitoring.
How Does TrakOp Help Balance the Risk of Understocking & Overstocking?
Understand the impact of understocking & overstocking on your business and how to optimize inventory management effectively.
7 Online Ordering Systems — Which One Fits Your Industry?
Compare the 7 best online ordering systems for recurring and on-demand businesses — Trakop, Deonde, MDS, WDS, Toast, Deliverect, and Chowbus.
How Does a Water Delivery Driver App Help You Acquire New Customers?
Explore how a Water Delivery Driver App can help your bottled water business acquire new customers and thrive in competition.